Sydney has a high risk of floods with 1.4 million people living in LGAs at high and very high risk of flood due to extensive development in the floodplains of the Hawkesbury, Georges and Cooks rivers and their various tributaries. In Regional NSW, 1.7 million people live in LGAs at high and very high risk of flood. This includes the LGAs of Lismore, Richmond Valley and Clarence Valley.
Storms and flooding can impact agricultural and mineral production, urban transport systems and air travel. Heavy rainfall also impacts the road network via reduced speeds, areas of flooding and more accidents. Storms can heavily impact air travel, which does not significantly damage infrastructure but disrupts short term activity.
Summary tables
The summary tables below present the 2017-18 LGA population by risk level for four natural perils (bushfire, flood, storm and tropical cyclone) for New South Wales, Victoria and Queensland.
The risk ratings are useful in comparing areas for the same peril (e.g. comparing flood risk between two LGAs), however, the risk ratings for the various natural perils are not comparable to each other. That is, the risk or potential impact of earthquake in an extreme risk area is not the same as an extreme risk for bushfires.
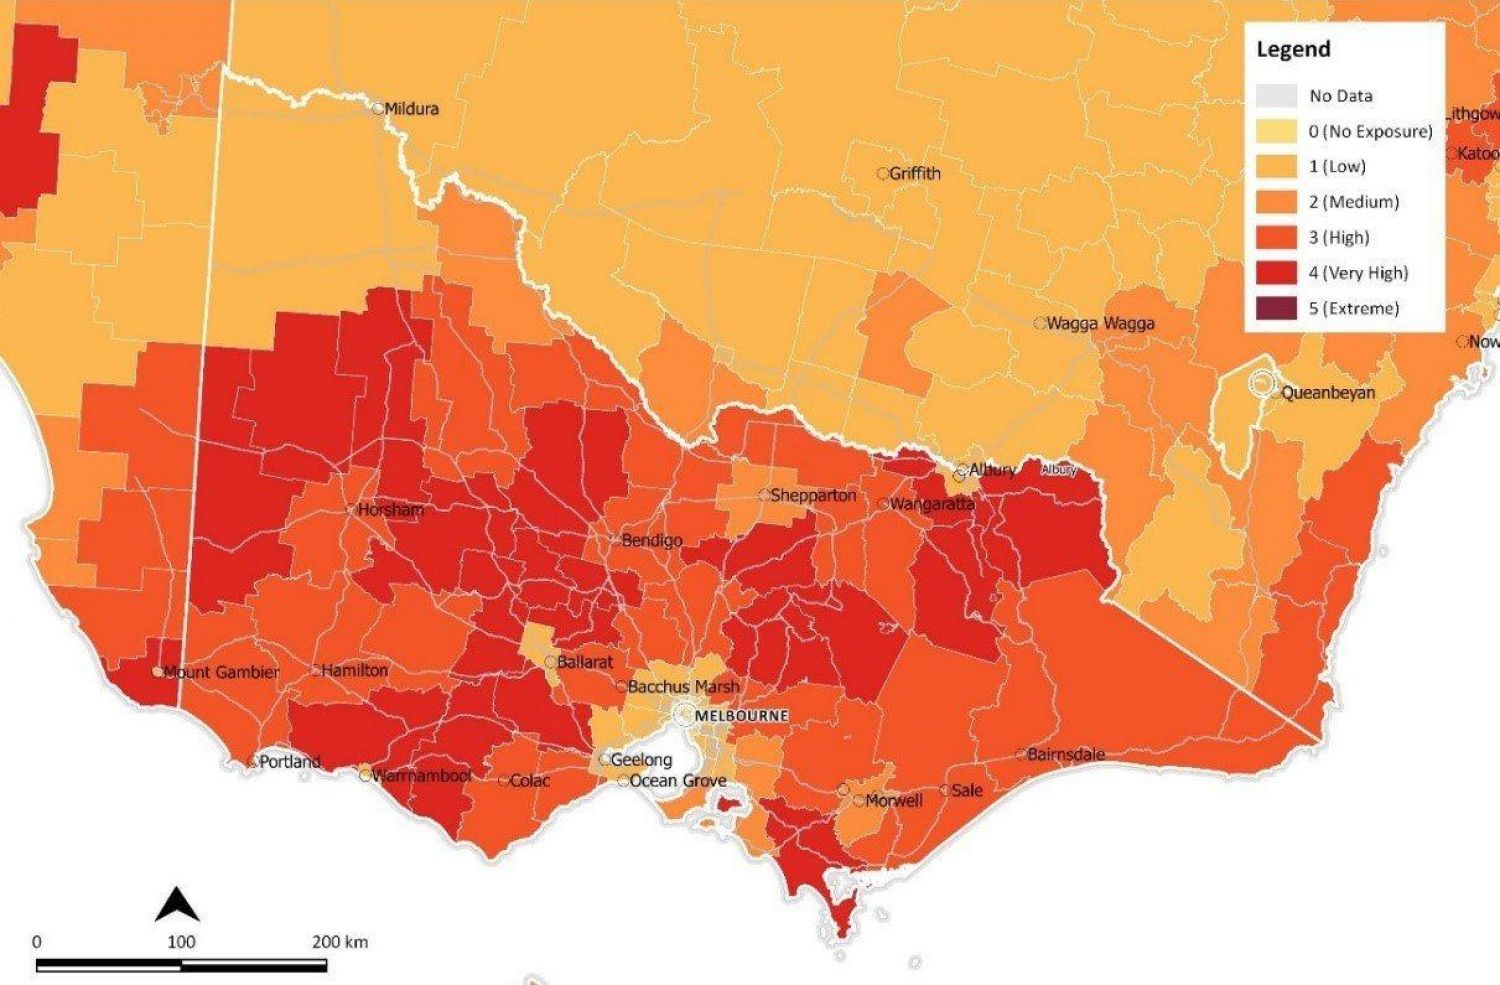
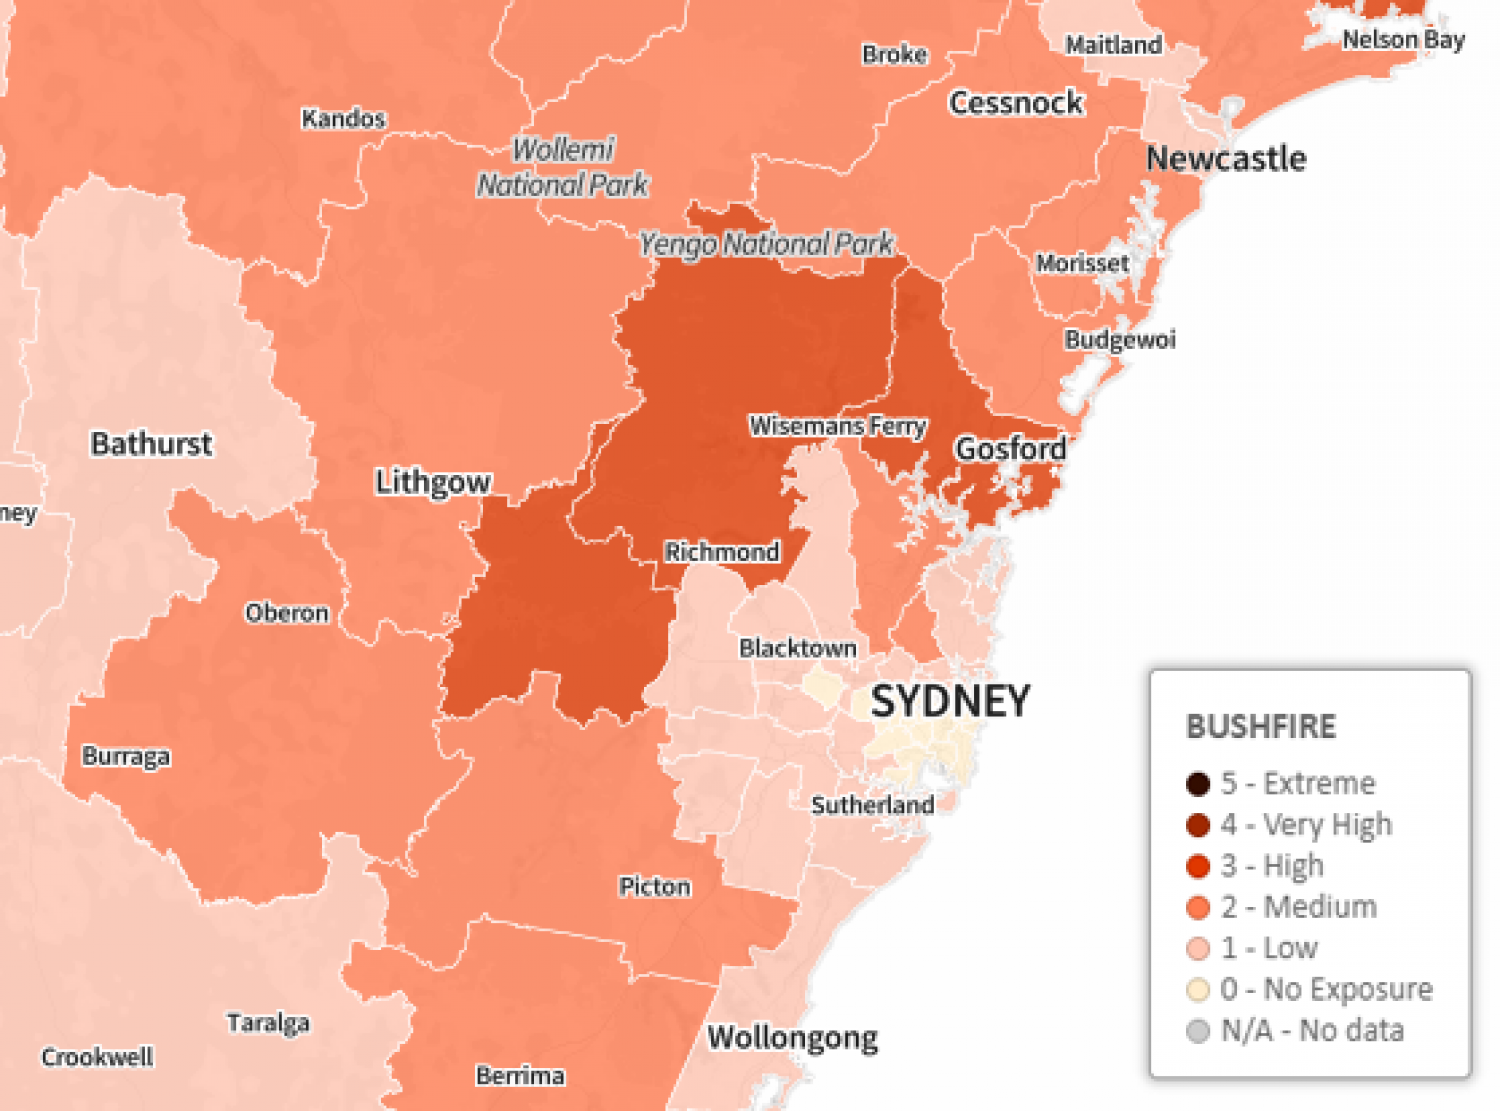
Table 1: Bushfire Risk - LGA 2018 Population by Risk Level
| Greater Sydney | Rest of NSW | Greater Melbourne | Rest of Vic | Greater Brisbane | Rest of QLD |
| Extreme | - | - | - | - | - | - |
| Very High | - | 9,500 | - | 247,000 | - | - |
| High | 318,000 | 241,500 | 223,000 | 635,000 | - | 1,000 |
| Medium | 488,000 | 1,120,000 | 273,000 | 200,500 | 225,500 | 781,000 |
| Low | 2,830,000 | 1,361,000 | 2,889,500 | 491,500 | 2,231,500 | 1,601,500 |
| No Exposure | 1,454,500 | 17,500 | 1,501,500 | - | - | 38,500 |
Table 2: Flood Risk - LGA 2018 Population by Risk Level
| Greater Sydney | Rest of NSW | Greater Melbourne | Rest of Vic | Greater Brisbane | Rest of QLD |
| Extreme | - | - | - | - | - | - |
| Very High | 67,000 | 291,000 | - | 66,000 | - | 30,000 |
| High | 1,298,000 | 1,436,000 | 170,000 | 172,000 | 1,471,000 | 632,000 |
| Medium | 1,566,000 | 853,000 | 761,000 | 1,011,000 | 829,000 | 1,842,000 |
| Low | 1,274,000 | 118,000 | 1,191,000 | 377,000 | - | 1,000 |
| No Exposure | 780,000 | 20,000 | 2,765,000 | 35,000 | 157,000 | 22,000 |