Insights

How does the wellbeing of cities and regions influence where we choose to live?

Posted September 19, 2023

SGS Economics and Planning ESL Wellbeing

Building on the release of the SGS Cities and Regions Wellbeing Index, this article investigates early evidence of a wellbeing effect on Australia’s internal migration between 2016 and 2021.

Before diving in, it is worth noting that migration patterns observed between the 2016 and 2021 census include the period covering the COVID-19 pandemic. This period saw changes in internal migration patterns.

Social scientists have long been interested in forms of mobility that collectively shape society’s social structure. Seminal studies in this field have charted the intergenerational mobility shaped by family background, the impacts of who we know on economic outcomes, and the racial and gendered effects of income mobility.

One of the prevailing challenges for public policy is understanding and monitoring these dimensions of mobility in real-time. Data availability, granularity, and the ability to perform data linkage present some complexities, as does the ability to isolate cause and effect for complex social phenomena. The result? Opportunity gaps tend to be invisible until it is too late.

The Cities and Regions Wellbeing Index (CRWI) is a spatially detailed measure combining communities’ performance on social, economic, and environmental indicators. Using CRWI data, we have explored population mobility through a wellbeing lens to ask: Does wellbeing affect internal migration?

What draws us to a community or place to live is both personal and shared. Household decisions on where we live are often motivated by the appeal of better opportunities for a better quality of life. Exploring the links between SGS’s Cities and Regions Wellbeing Index and Australia’s internal migration patterns helps to uncover spatial trends in where and why we move.

— Michelle Tjondro, SGS Associate

Spatial trends in wellbeing mobility

Figure 1 shows how moves between locations with similar wellbeing scores dominate internal migration in Australia between 2016 and 2021. This is true irrespective of which wellbeing band (Low, Medium, High) one previously lived in 2016. The visualisation is agnostic to the distances moved and instead focuses on whether internal migrants move to locations with better or lesser wellbeing outcomes.

From 2016 to 2021, 21 per cent stayed in the lower wellbeing band, 53 per cent in the medium wellbeing band, and 15 per cent in the higher wellbeing band. Note that all figures include the population who did not change their place of usual residence between the 2016 and 2021 Census (47.9 per cent of the nation’s population). This ensures a meaningful comparison with the inter-band movements shown in Figure 1.

Moving between bands was far less common. For example, three per cent of all internal migration was from a lower wellbeing SA3 to a medium wellbeing SA3, while 2.5 per cent of all moves were from a higher wellbeing SA3 to an SA3 of medium wellbeing. The rarest move (< 0.5 per cent of all internal migration 2016-21) consisted of moves from lower to higher wellbeing SA3s, or vice versa.

Figure 1: Relative internal migration volumes by origin and destination CRWI score, 2016-21
SGS Economics and Planning Graphics Page 1
Source: SGS Economics and Planning (2023). Reading this chart: Each panel depicts the aggregated flows between SA3s nationally based on SA3s’ CRWI score. For example, the leftmost panel highlights the relative flow of internal migration from Origin SA3s (Place of Usual Residence in 2016) with higher wellbeing scores to Destination SA3s (Place of Usual Residence in 2021) of high, medium, and low CRWI score. For this analysis, SA3s were categorised based on the following wellbeing score thresholds: High > 5.5, 5.5 > Medium > 4.5, 4.5 > Low.

This preliminary analysis of internal migration along wellbeing lines mirrors what is also suggested elsewhere in the literature: that social class affects where one moves. Termed socio-economic sorting, this describes the process of selective population shifts that is driven by determinants such as housing affordability, educational and employment opportunity, and other magnets for residential choice, all of which are reflected in the CRWI. Recent scholarship in the Australian context reveals the rise of residential segregation by education and occupation in our major capital cities.

The comparative analysis below highlights a stark contrast in the spatiality of moves to higher wellbeing SA3s (Figure 2) and moves to lower wellbeing SA3s (Figure 3). As 2016-21 internal migration characterised by a movement of +/- 2 in CRWI score was concentrated along the east coast, only this region is shown in the maps. The map colours show the direction of population migration while the thickness of the line shows relative volume. Moves of fewer than 100 people are also excluded to highlight the salient trends.

Whereas internal migration to higher wellbeing areas is relatively contained within the Sydney and Brisbane capital city areas (Figure 2), moves to lower wellbeing areas are significantly more spatially distributed (Figure 3). The latter includes migration from Greater Sydney to NSW’s North Coast and coastal suburbs in Queensland’s Gold Coast.

Figure 2: Internal migration to higher wellbeing, 2016-21
Graphics revised Page 12
Graphics revised Page 2
Source: SGS Economics and Planning (2023)
Figure 3: Internal migration to lower wellbeing, 2016-21
Graphics revised Page 3
Source: SGS Economics and Planning (2023)

Migration motives: A wellbeing perspective

The analysis suggests that ‘upward’ wellbeing mobility between 2016-21 was concentrated within Greater Sydney, with the exception of the migration flow from Strathpine to The Hills District, while the top 5 moves (by population volume) to a residence of lower wellbeing were distributed between Greater Sydney (Hawkesbury to Richmond – Windsor, Warringah to Wyong), Greater Brisbane (The Hills District to Strathpine, Centenary to Forest Lake – Oxley) and from Tea Tree Gully to Playford in Greater Adelaide.

Table 1: Internal migration by wellbeing and population volume, 2016-21
SGS Economics and Planning table1 ESL
Source: SGS Economics and Planning (2023). * A note about alignment between CRWI 2022 and internal migration data from the ABS Census of Population and Housing: Source data for the CRWI’s 20 indicators is predominantly drawn from the 2021 ABS Census (refer to page 50+ in the CRWI report). Due to CRWI was commencing in 2022, a 2016 score is not available, thus there is an assumption that the relative wellbeing of cities and regions in 2016 is similar to that in 2022. Future CRWI releases will remove the requirement for this assumption.

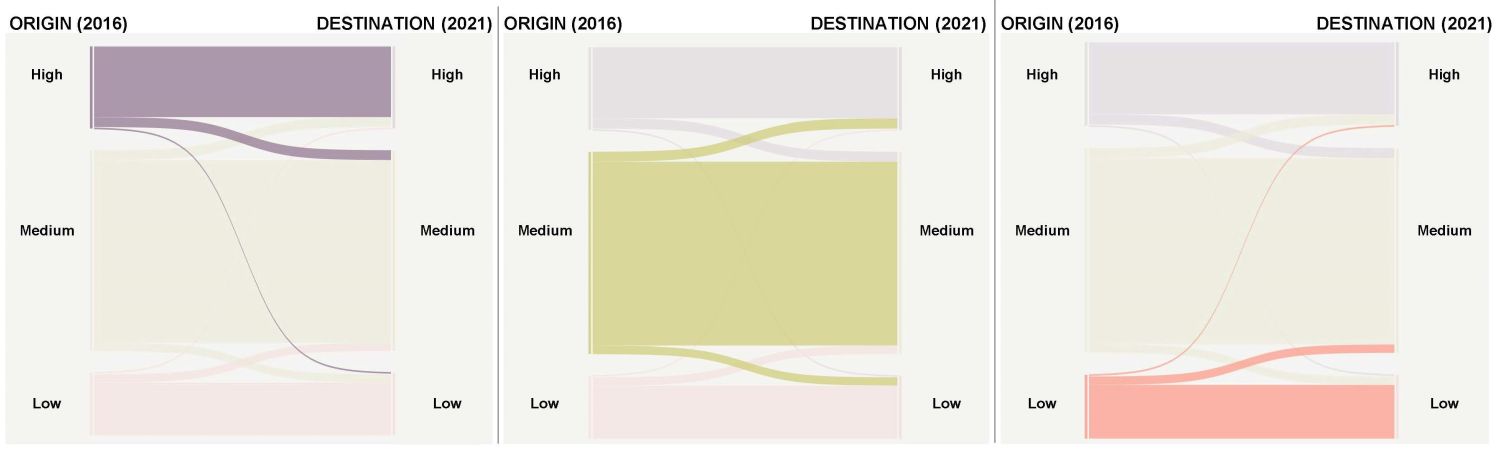
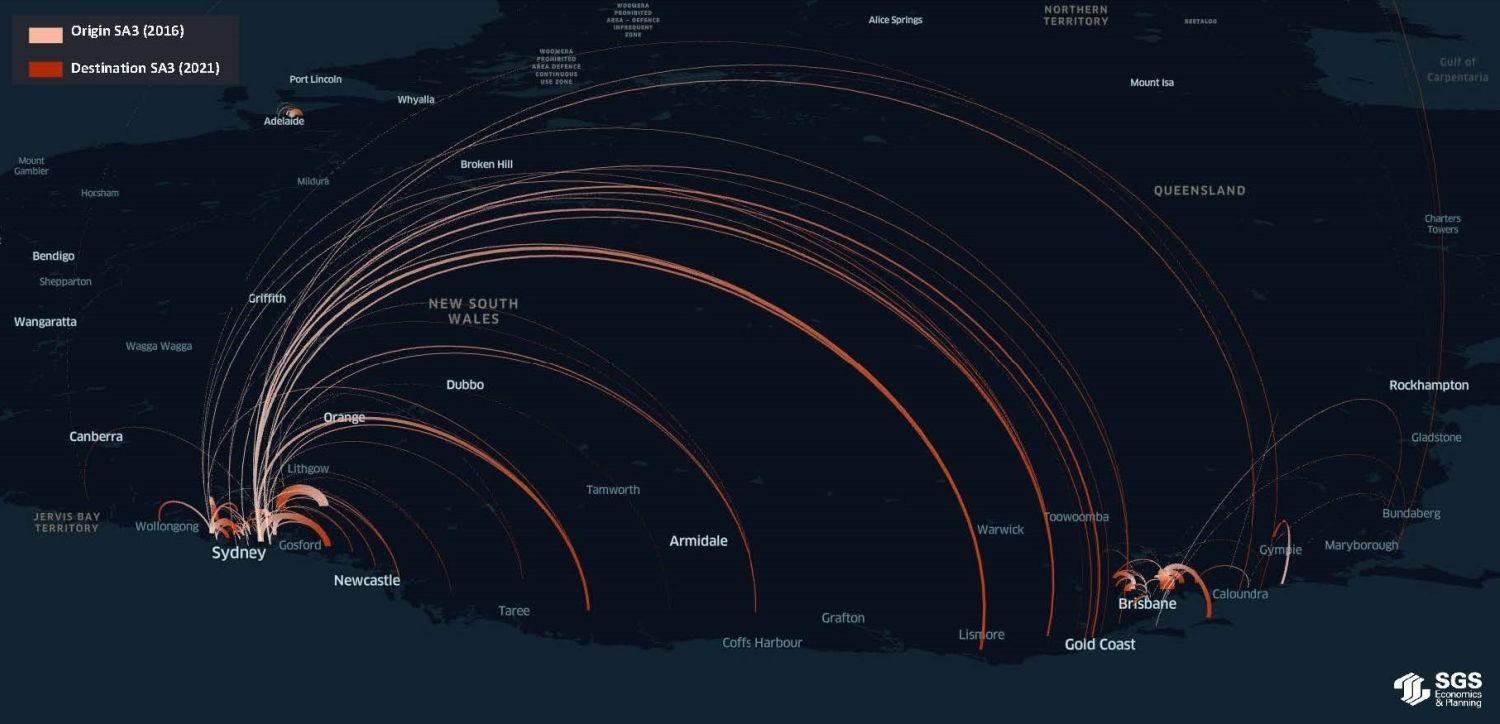
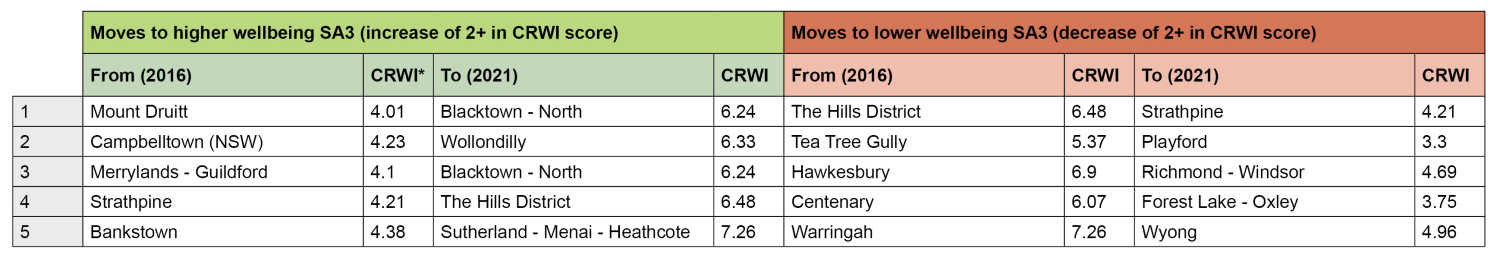
The above suggests that some SA3 pairings – Strathpine and The Hills District, for example – experience relatively high volumes of internal migration between them in both directions of wellbeing mobility. Other destinations, Blacktown – North, appear to draw relatively high volumes of internal migrants from lower wellbeing SA3s.

Given the detail of the CRWI, future analysis could examine which dimension(s) of wellbeing appear to have stronger effects of migration flows. A preliminary analysis of the top five moves to higher wellbeing areas (Table 1) shows that these were moves to a neighbourhood with:

  • An Employment, Knowledge & Skills dimension that scores between 3.71 to 7.35 points higher (on a scale of 0-10) than their old neighbourhood.
  • A Housing dimension scores between 3.86 and 5.12 points higher (on a scale of 0-10) than their old neighbourhood.

In comparison, the top five moves to higher wellbeing SA3s also resulted in slight decreases in the Economy dimension score, suggesting that residential choice is significantly motivated by factors beyond Gross Domestic Product (GDP).

There is a growing spectrum of efforts to understand wellbeing at a national, regional and community level. The availability and quality of data will inform policy decisions that shapes what is needed for communities to flourish.

This article illustrates that residents largely remain within the same objective wellbeing bands, which will impact their individual or subjective wellbeing experience. When residents do move homes, the data shows they often relocate to places with higher wellbeing according to the indicators in the framework. In moving, people seek to improve their wellbeing outcomes, particularly their economic opportunities or housing affordability. Further understanding these mobility patterns and their link to wellbeing can inform the approach to addressing the housing crisis and increasing spatial inequality.

Federal, state and local strategic plans and policies, where possible, should seek to improve wellbeing outcomes for those living in locations with lower scores. Targeting additional housing supply could be focussed to create more opportunities to live in locations that score higher on the wellbeing index. This will help create happier, healthier and more resilient communities.


Interested in this topic?

This article is related to another piece that looks into how the pandemic is affecting Australia's population growth, based on data. Additionally, we released the SGS Cities & Regions Wellbeing Index, a report and interactive tool that assesses the impact of public policy decisions on people's lives in different areas.


Connect with us on LinkedIn


SGS Economics and Planning Michelle Tjondro Square Colour
For further information contact:

Michelle Tjondro

Senior Associate | Executive Director

View profile →