Insights

A tale of two economies: How Auckland compares to Australia

Posted September 11, 2025

SGS Economics and Planning NZ Article

As Aotearoa New Zealand looks ahead, Auckland’s economic journey over the past decade offers a revealing look at what drives urban resilience and where future opportunity lies.

New Zealand is only gradually emerging from recession, and conditions remain challenging for many households and businesses. In times like these, it’s helpful to step back from the immediate pressures and take a longer-term view of the economy’s trajectory. A natural starting point is Auckland — the country’s economic powerhouse, contributing nearly 40% of New Zealand’s GDP.

Over the past decade, Auckland’s metropolitan economy has outpaced its Australasian counterparts. Between 2014 and 2024, the region grew at an average annual rate of nearly 3.5% (adjusted for inflation). This is a significantly faster pace than that achieved by the OECD group of countries in recent times.

SGS Economics and Planning NZ Charts 01 01
Source: Infometrics and SGS Economics & Planning Pty Ltd (Note: Auckland data is based on year ending March. Australian data is based on year ending June.)

What’s driving Auckland’s economic performance?

Auckland’s strong economic performance over the past decade likely stems from a combination of factors: a growing workforce, increased investment in capital such and plant and equipment, and gains in productivity driven by technology and innovation. While all three may have played a role, population growth appears to have been the dominant driver.

The income gap: Auckland vs. Australasia

On a per capita basis, Auckland’s gross regional product (GRP) is nearly 25% lower than Sydney’s. When all income sources are considered—from wages and salaries to dividends and rental income, Aucklanders earn NZD20,000 less per year than their counterparts in Sydney. In fact, Auckland ranks below all major Australasian cities on this measure, with the sole exception of Adelaide.

SGS Economics and Planning NZ Charts 01 02
Source: Infometrics and SGS Economics & Planning Pty Ltd (Note: Auckland data is based on year ending March. Australian data is based on year ending June.)

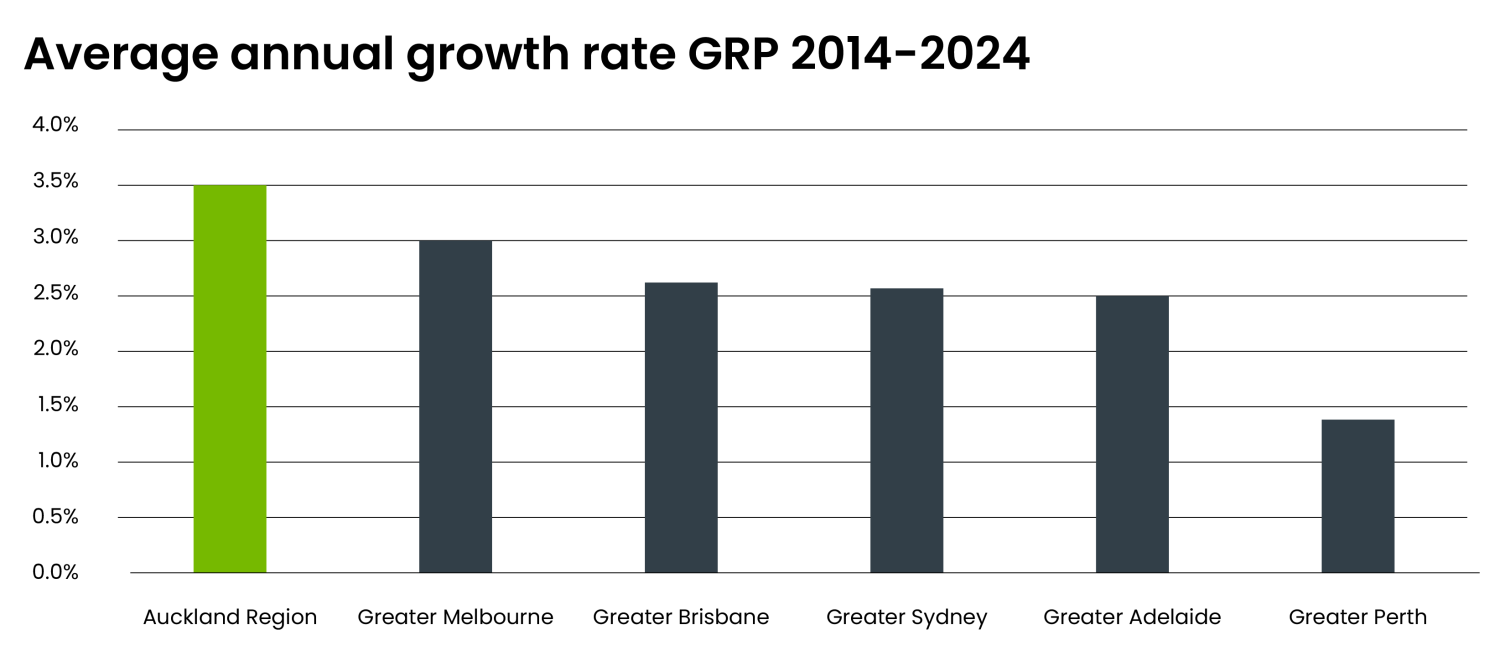
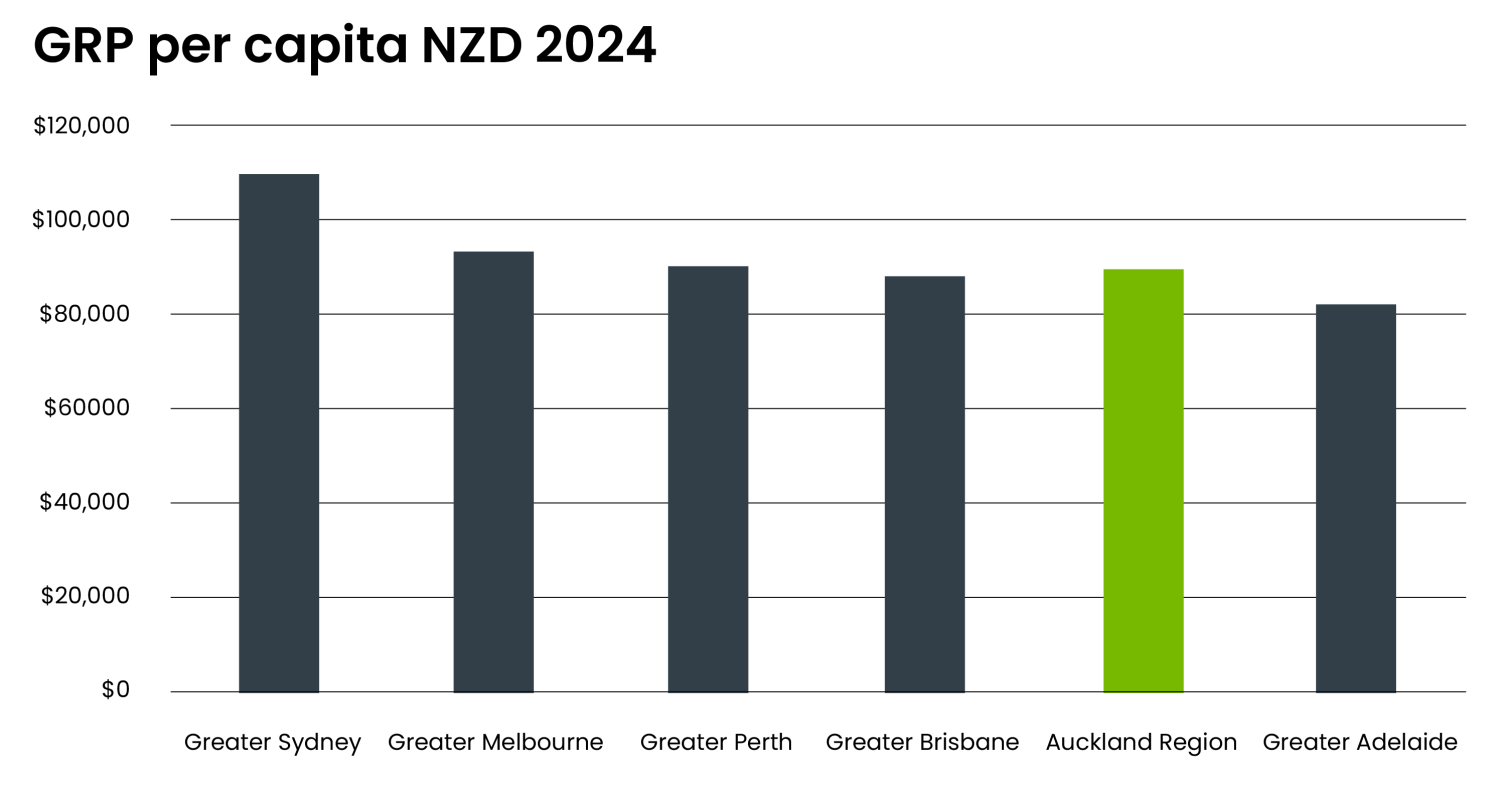
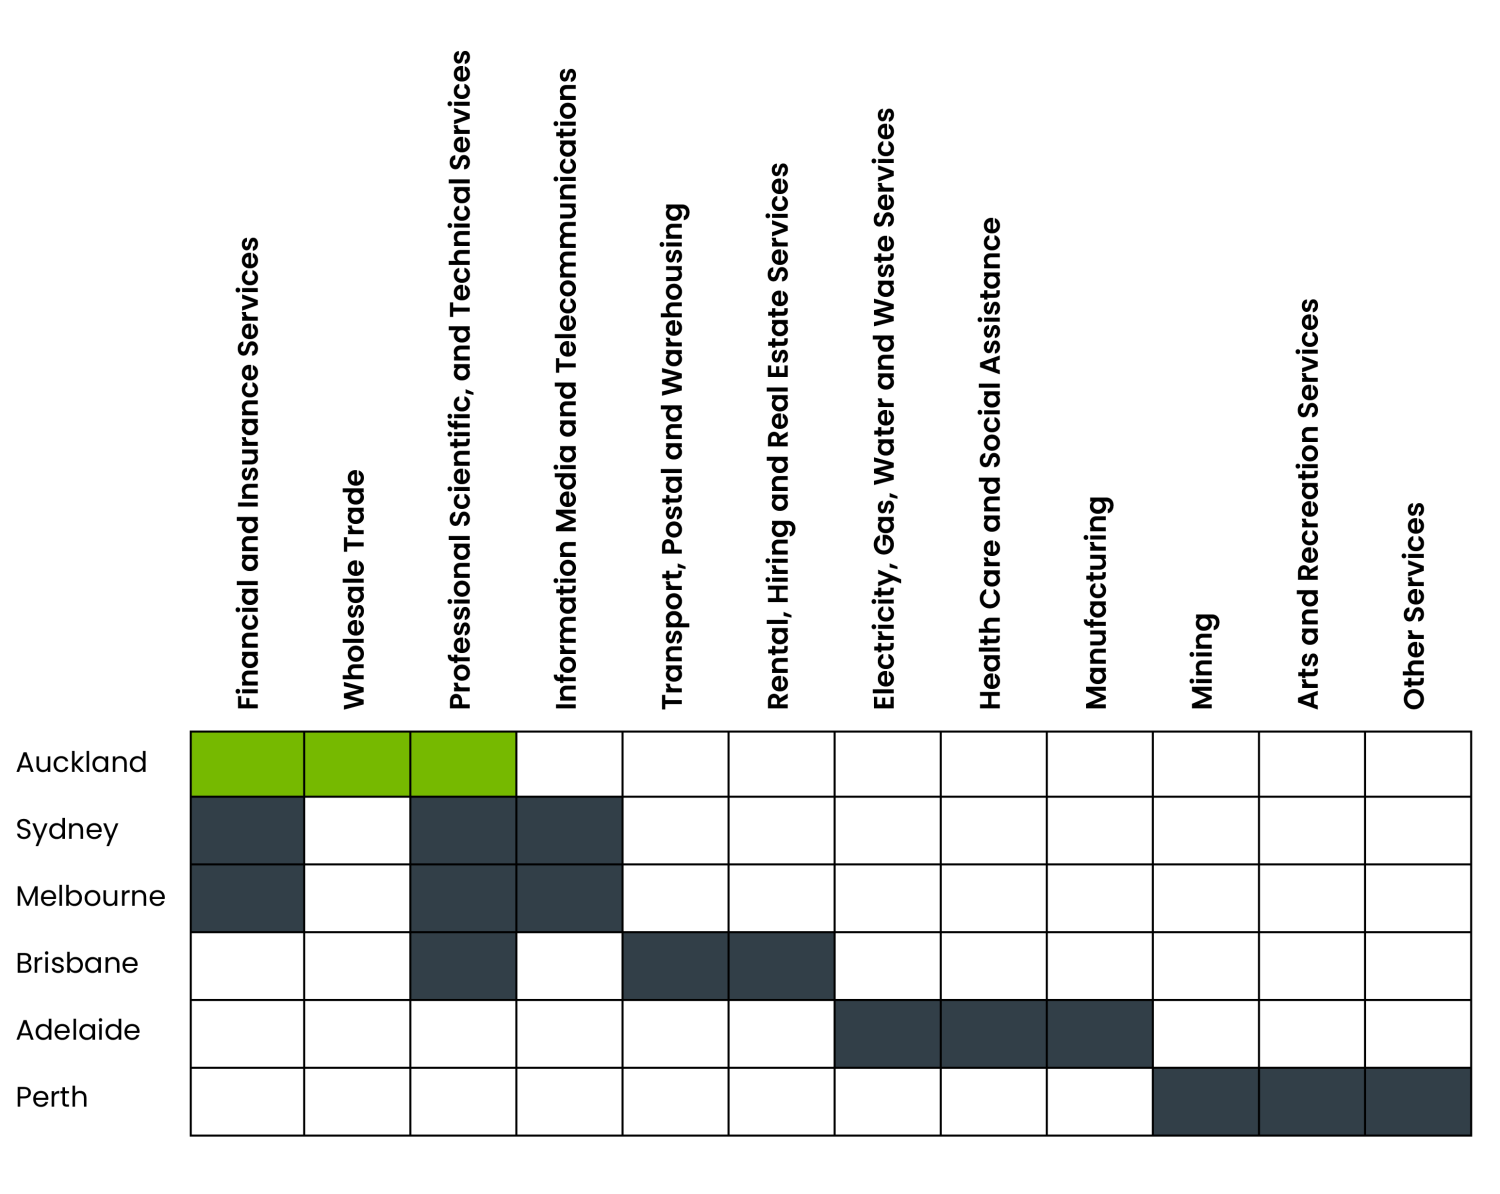
On paper, Auckland is well-positioned to close the GRP gap with its Australasian peers. Like metropolitan Sydney and Melbourne, Auckland plays a distinctive role in the national economy—not just because of its scale, but due to its concentration in finance, brokerage, and advanced business services. In contrast, other Australasian cities tend to specialise in industries such as manufacturing, mining, and personal services, which face more intense competition and limited growth prospects.

Auckland’s areas of specialisation are strategically important in modern, prosperous economies. These sectors underpin productivity and competitiveness across the board—from local retailers to major agribusiness operating far beyond the city. Advanced business services also serve as channels for innovation, helping new ideas and methods spread throughout the wider economy.

Building a city for the future

The challenge now is to grow the dynamism and depth of Auckland’s advanced business services sector. This means building a city that is both efficient and attractive. Efficiency requires world-class public transport—especially given the central city concentration of service jobs—and regulatory best practice to ensure developers can respond quickly to changing demand for housing, offices, factories, and creative spaces. Attractiveness, meanwhile, is shaped by place quality, cultural vibrancy, social cohesion and lifestyle.

Auckland’s growth over the past decade reflects more than just local success signals strategic potential for New Zealand’s broader economic future. With strengths in advanced business services and a central role in the national economy, Auckland is well-placed to lead the next phase of recovery and innovation. Realising this potential will require thoughtful investment in infrastructure, planning, and urban quality, not just for Auckland, but for the benefit of the entire country.

SGS Economics and Planning NZ Charts 03
Source: SGS Economics and Planning Pty Ltd, 2025

Connect with us on LinkedIn


SGS Economics Planning Marcus Spiller
For further information contact:

Marcus Spiller

Principal & Partner I Executive Director

View profile →
SGS Economics and Planning Paul Howorth
For further information contact:

Paul Howorth

Leading our work in Aotearoa New Zealand

View profile →