Insights

From neighbourhoods to nation: Mapping wellbeing through the SGS Cities and Regions Wellbeing Index

Posted October 15, 2025

SGS Economics and Planning CRWI2

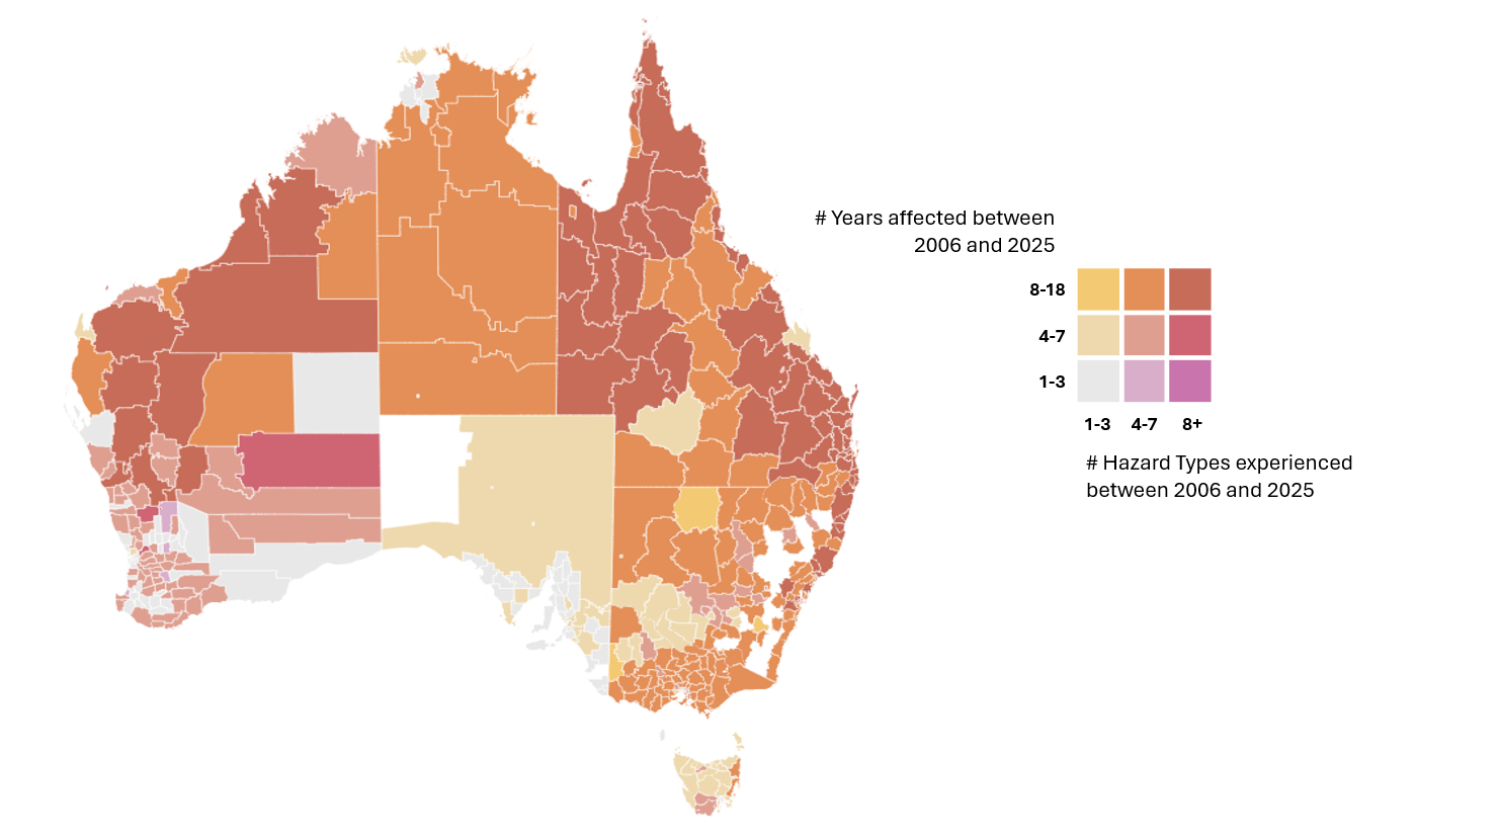
From the Red Centre to the coast and the cities in between, this year’s SGS Cities and Regions Wellbeing Index highlights how place shapes our quality of life.

About the SGS Cities and Regions Wellbeing Index

The SGS Cities and Regions Wellbeing Index (CRWI) is an annual publication developed by SGS to fill a gap in the availability of objective wellbeing data at the local level.

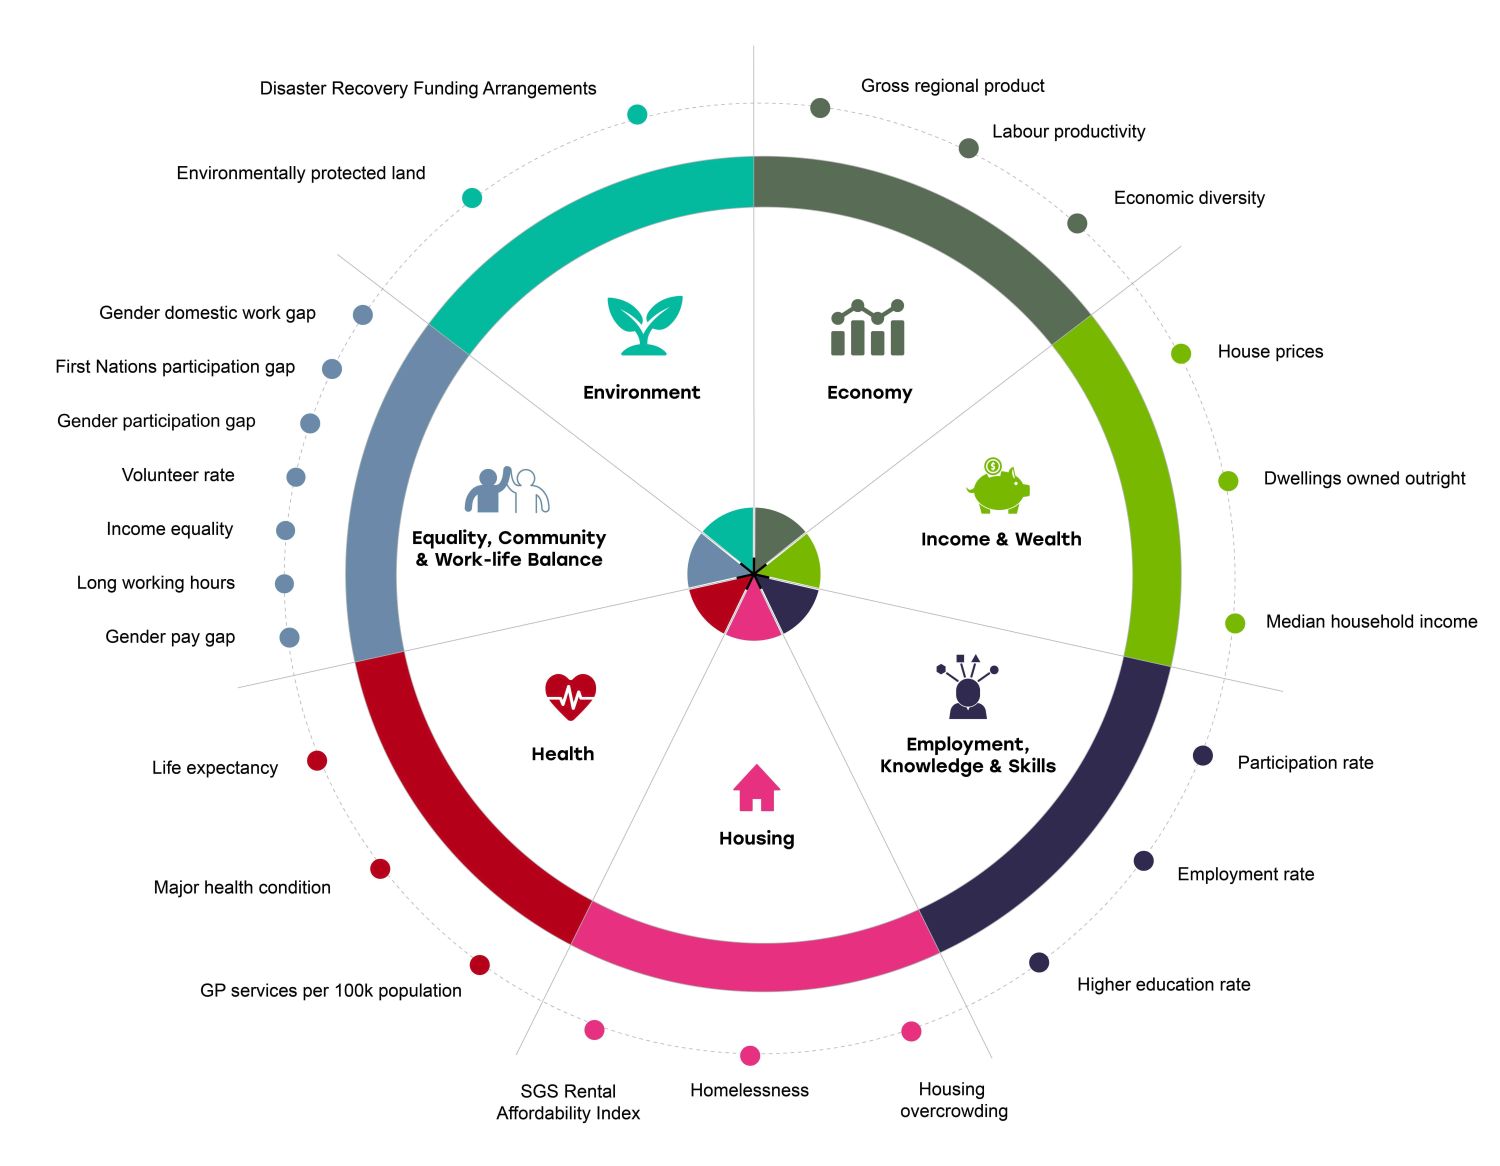
The Index brings together seven dimensions and 24 indicators of wellbeing, reported by local government area (LGA), to provide a detailed picture of how communities across Australia are faring.

The CRWI Dashboard and Report provide a practical entry point for understanding a community’s relative performance across key areas, including health, education, equality, and economic resilience. These insights are designed to inform decision-making at all levels of Australian government, and to support community groups and changemakers in strengthening wellbeing outcomes nationwide.

SGS Economics and Planning Diagram 2025 website article 06

What’s new in CRWI 2024

  1. An improved interactive dashboard—making it easier to explore and compare wellbeing data across Australia. Explore here.
  2. New indicators—added to the Health and Environment dimension.
  3. A new Census-cycle approach—with a major data refresh following each ABS Census, and targeted updates in the years between for indicators with annual data.

In this release, five indicators have been updated across the Economy, Health, and Environment dimensions.

What we learnt in 2024

Nationally, strong spatial patterns shape wellbeing.

Across Australia, clear spatial patterns emerge in overall wellbeing. Outcomes tend to be higher in urban areas—particularly where people have access to secure jobs, quality education, primary health care, and smaller gender pay gaps. But these advantages are often tempered by challenges such as poor rental affordability and lower rates of volunteering compared with many regional communities.

Economic growth and resilience continue to drive Australia’s success, but they matter little to those simply trying to find an affordable home, access healthcare, or achieve equality at work. Putting holistic wellbeing at the heart of policy and investment decisions benefits everyone.

— Michelle Tjondro, Lead Author of the SGS Cities and Regions Wellbeing Index

In rural and remote areas, lower wellbeing reflects a different set of pressures. Long travel distances limit access to essential services, while smaller populations make service delivery costly and complex. The social and economic toll of increasingly frequent natural disasters is also profound—especially in regions where agriculture underpins local economies and where communities have faced successive shocks with little time to recover.

Figure 1: Headline wellbeing by GCCSA, 2024

SGS Economics and Planning chart1 CRWI
Source: SGS Economics and Planning (2025)

Evolving economic structures

Australia’s economic landscape continues to shift as industries adapt to new technologies, markets, and workforce needs:

  • Structural change across the decade: From 2014-2024, the composition of industries contributing to GDP changed significantly across regions.
  • Tasmania leads the transformation:
    • In Greater Hobart, traditional industries, such as agriculture, manufacturing, and transport, declined from 39% to 19% of the Gross Regional Product (GRP).
    • The Rest of Tasmania saw a similar pattern, with traditional industries' share of GRP falling by over 10 percentage points, offset by a rise in the share of health, education, and knowledge-based sectors.
  • Western Australia diverges:
    • In contrast, both Greater Perth and Regional WA recorded growth in traditional industries—particularly mining and transport—while population-serving sectors declined in their share of GRP by 7 and 3 percentage points, respectively.
    • Western Australia and regional Queensland were the only regions where traditional industries increased their share of GRP.

Overall, governments and businesses have shown adaptability in navigating these traditions, but the pace and impact of structural change remain uneven across the country.

Figure 2: Australia’s changing industry mix, 2014 to 2024

SGS Economics and Planning Changing industry
Source: SGS Economics and Planning (2025), ABS Australian National Accounts: State Accounts (2013-14 to 2023-24)

As wellbeing economics continues to evolve, our shift to align the Index with the national Census cycle shows a long-term commitment to tracking how Australians are really faring over time. This approach allows space for deeper research and collaboration, helping to build a stronger evidence base that can guide policy for years to come.

— Yuan Deng, Lead Author of the SGS Cities and Regions Wellbeing Index

Compound disaster events

Successive and overlapping disasters make recovery far more difficult for communities already under pressure.

  • Many parts of northern Australia have faced four or more hazard types, such as fire, flood and cyclone, over extended periods
  • In 29 local government areas, disaster recovery assistance was triggered at least once every year for over 15 years, since 2006.
  • The south-west and south-east have each experienced between four and seven different hazard types, though New South Wales and Victoria have faced longer and more frequent exposure than southern Western Australia.

These patterns highlight the cumulative impact of recurring disasters and the necessity for sustained investment in resilience and recovery.

Figure 3: Number of disaster affected years and distinct hazard types, LGA, 2006-25

SGS Economics and Planning Hazards Map CRWI
Source: SGS Economics and Planning (2025), NEMA (2025)

Redefining prosperity

For too long, Australia’s progress has been measured largely through Gross Domestic Product, a narrow lens focused on economic output, with little regard for social or environmental costs.

While the idea of a wellbeing economy may seem like a modern mission, its roots stretch back nearly 25 years, from the Measures of Australia’s Progress to the Australian Treasury’s Wellbeing Framework and, most recently, the Measuring What Matters Framework. The SGS Cities and Regions Wellbeing Index builds on this legacy, putting people and planet at the centre of policy and investment decisions. It provides the local evidence needed to shape actions that help communities across Australia truly thrive.


Dive into the data

SGS Economics and Planning CRWICOVER

Connect with us on LinkedIn


SGS Economics and Planning Michelle Tjondro Square Colour
For further information contact:

Michelle Tjondro

Senior Associate | Executive Director

View profile →
SGS Economics Planning Yuan Deng
For further information contact:

Yuan Deng

Principal & Partner

View profile →