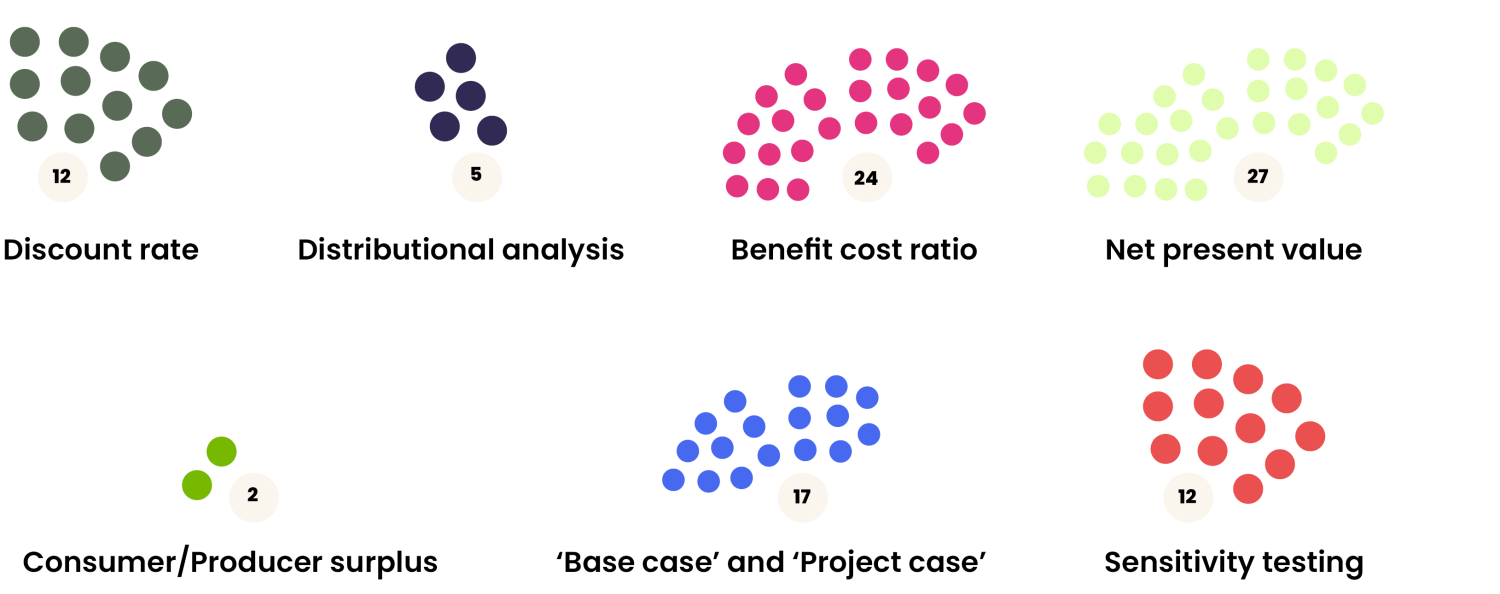
Two terms clearly stood out as the least familiar among participants: Distributional analysis and Consumer/ Producer surplus. This aligns closely with what we observe when reviewing CBAs prepared externally, as well as in our conversations with clients and funding agencies.
There’s often a strong focus on producing a Benefit Cost Ratio (BCR) and Net Present Value (NPV) once relevant costs and benefits are monetised. While most analysts do identify and describe key costs and benefits that are not monetised, the “distributional analysis” is frequently overlooked or glossed over.
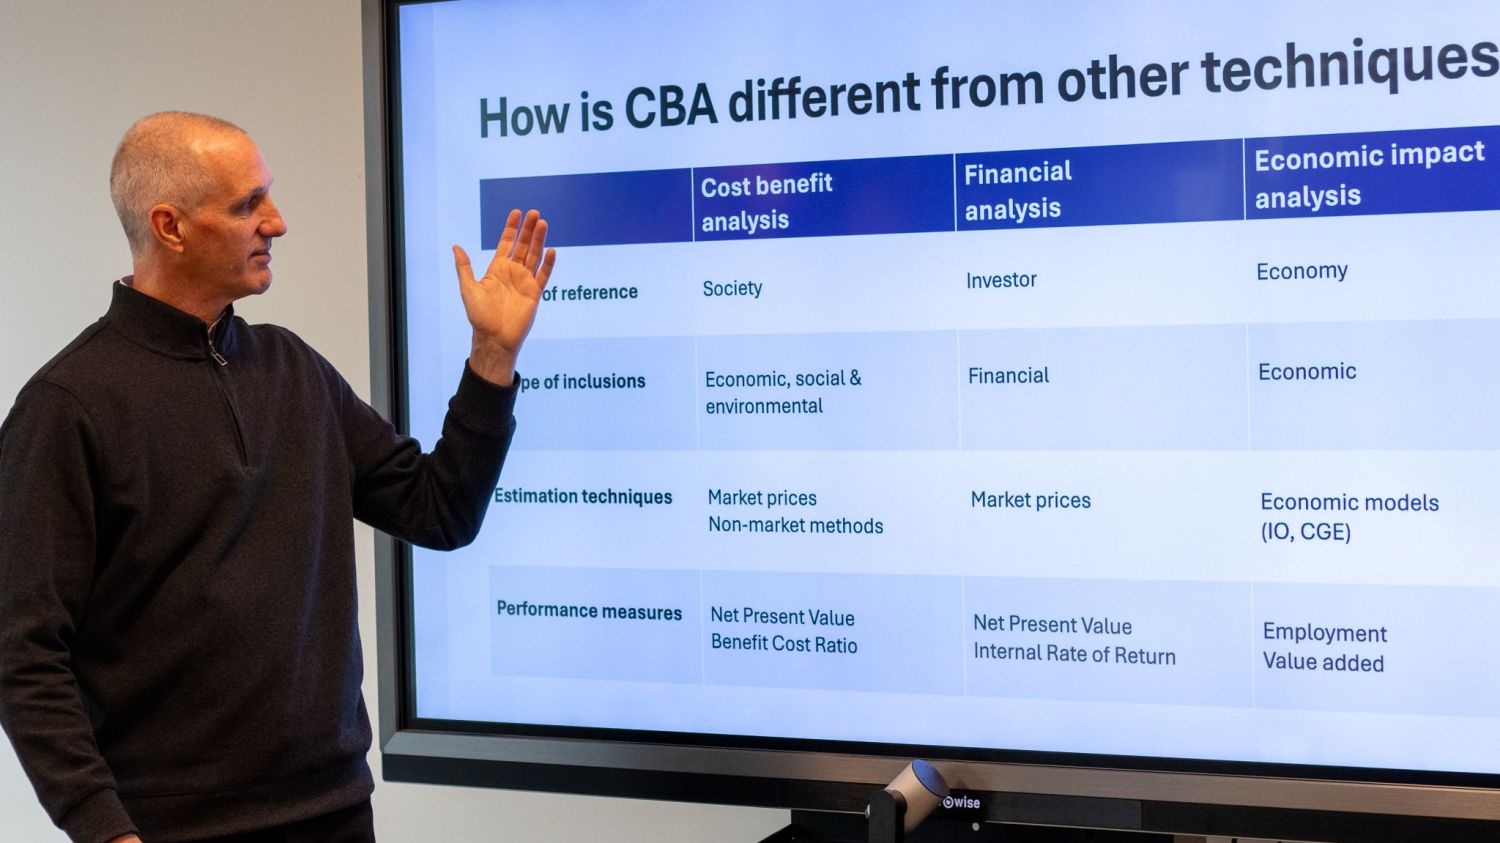
This stems from the traditional focus in the application of CBA on answering the following question about proposed or past initiatives: Do the benefits of the initiative outweigh its costs, when a broad societal perspective is taken?
This broad societal perspective has two elements to it:
- All relevant costs and benefits are considered, including economic, social and environmental impacts.
- Only aggregate costs and benefits are included, meaning only net gains or losses to society are considered, while transfers of costs and benefits between societal groups (which cancel each other out) are excluded.
Distributional analysis
Distributional analysis is the second question that CBAs should answer: Who are the winners and losers from the initiative, and is this socially equitable?
Because CBA performance measures don’t account for transfers between societal groups, this aspect often receives too little attention. While these transfers may cancel each other out, they still represent real impacts — with distinct winners and losers in the process.
Distributional analysis brings transparency to how different stakeholder groups are affected. It involves:
a) identifying which costs, benefits and transfers are experienced by each group
b) determining if each group is likely to experience a net positive or negative impact overall.
Without solid distributional analysis, decision-makers are only seeing part of the picture.
Societal groups can be examined in many ways, and distributional analysis can use the following approaches to assess impacts among a range of others:
- Geographies
- Household incomes
- Cultural backgrounds
- Genders
- Barriers to engagement (e.g. people with disability, poor English proficiency, etc).
When assessing impacts on First Nations communities, a different approach is often required. These communities may hold values that differ significantly from Western frameworks, and assigning dollar values to certain impacts can risk disengagement altogether. In our experience, adopting a two-way knowledge-based evaluation process is more likely to lead to meaningful and productive outcomes.
Consumer/ Producer surplus
Non-economists don’t need to speak the language of consumer and producer surplus, but they do need to understand the thinking behind it. Without the foundation, the benefits presented in a CBA risk being significantly overstated.
Consumer surplus refers to the benefit a consumer gains from a good or service beyond what they pay for it. For example, if someone is willing to pay $70 to attend an event but is only asked to pay $30, they experience a benefit (or surplus or gain) of $40.
This is all very straightforward when market prices are available (i.e. the $30 entry fee above). However, when market prices are absent (e.g., free entry), alternative techniques are often employed to estimate benefits.
In cases where market prices aren’t available, analysts often estimate benefits using the opportunity cost of leisure time, typically $20 per hour. For example, if an event runs for two hours, the benefit isn’t simply 2 hours x $20 per hour = $40. That’s because the attendee sacrifices their time to participate, which is a real cost. To account for this, the “rule of half” is commonly applied, reflecting the downward slope of the consumer demand curve: halving the benefit results in a more realistic value of $20.
Producer surplus refers to the benefit producers gain from selling a good or service at a price above their production costs, essentially their profit. A concept very well understood.
When assessing the benefits of job creation, it’s common to see prospective salaries treated as the full value of the benefit — but this overlooks opportunity costs. Workers are producers of labour services, and taking up a job comes with trade-offs: Full-time workers need to give up their existing salary. Part-time workers forgo both income and leisure time. Unemployed people give up their benefits and leisure time.
Robust CBA focuses on net gains to society — not just incomes, revenues, or experiences. Recognising opportunity costs and understanding who benefits ensures analysis reflects true societal value.
Our Melbourne training equipped participants with the tools to commission, manage, and interpret CBA with confidence — from foundational concepts to nuanced distributional insights.