Insights
Mapping the shifting landscape of socio-economic advantage
Posted May 29, 2023


Unveiling the latest release of the Australian Bureau of Statistics' Socio-Economic Indexes for Areas, we uncover the shifting landscape of advantage and disadvantage in Australia's major urban settlements over time.
In April 2023, the Australian Bureau of Statistics (ABS) released the 2021 Census Socio-Economic Indexes for Areas (SEIFA). SEIFA has a long-standing history dating back to the 1971 Census and has since become a widely used measure to understand spatial trends in community advantage and disadvantage.
This analysis focuses on the shifting distribution of advantage and disadvantage within Australia’s capital cities, providing a fresh perspective on the changes in socio-economic conditions typically not captured in traditional SEIFA reports.
Our findings reveal that between 2006 and 2021, some major cities have effectively reduced the advantage gap, while others have seen a rise in the proportion of disadvantaged areas. Meanwhile, a third cluster of cities has maintained a steady distribution of advantaged and disadvantaged areas.
This analysis marks the beginning of a deeper exploration into the reasons behind the improvements in relative advantage driven by public policy. It also sheds light on the areas that have demonstrated greater success in ensuring that no individual is left behind.
Undoubtedly, there is a need for a separate analysis focused on understanding the key factors in boosting and sustaining upward socio-economic mobility. This article concentrates on the initial step of understanding the evolving landscape of advantage and disadvantage. An overview of the factors that shape socio-economic mobility throughout an individual’s lifetime, and how policymakers can respond, is contained in this OECD article. The World Economic Forum’s inaugural Global Social Mobility Index 2020 discusses the case for fixing inequality, while recent research from the United States illustrates that creating more connections across class lines might be the most promising route to improving rates of upward economic mobility. According to Michelle Tjondro, one of the key analysts in the study:
The factors that sway relative advantage are complex and somewhat out of our direct control: where we live, who we know, what we receive and how early in life we access opportunities. The challenge for public policy is to narrow the advantage gap – how do we restore opportunities for those who are most in need?
What is SEIFA?
SEIFA assigns ranks to different areas based on their level of socio-economic advantage or disadvantage in Australia. The ABS defines these ranks by considering factors such as people's access to essential resources and their ability to participate in society. SEIFA data is released every five years and is derived from the social and economic information collected during the ABS Census of Population and Housing.
The ABS has published guidelines for using and interpreting SEIFA:
- SEIFA reflects the collective socio-economic profile of residents.
- SEIFA comprises four indexes, each focusing on a different concept of relative socio-economic advantage and disadvantage.
- SEIFA is best suited to a point-in-time spatial comparison.
While there is an element of time series in this study of SEIFA between 2006 and 2021, our analysis is not concerned with how an LGA (or even a capital city area, averaged from its LGAs’ SEIFA scores) performs over time. Instead, we focus on where and how the advantage gap widens or narrows. As SEIFA deciles are a relative measure of all LGAs nationally and normalised to the same scale (1-10), this offers a useful way to compare the changing share of relative advantage and disadvantage.
SEIFA has received criticism for potentially downplaying disadvantage due to the averaging effects across areas, which can result in assumptions about minority communities, such as Aboriginal and Torres Strait Islanders, based on the overall population. Despite these concerns, SEIFA continues to be a valuable tool for policymakers. It provides a comprehensive measure of relative advantage and disadvantage at the local level, enabling policymakers to understand spatial trends better and make more informed policy decisions. Torin Allen, a key analyst involved in the study, says:
The underlying 'shape' of disadvantage across our capital cities' population is underpinned by a dense history of global trends, policy-making and underlying city structure. However, the rapid shifts in these profiles hint at potentially more local interventions and changes yielding success or failures to cities residents. Definitely worthy of further investigation.
Shifting patterns of advantage and disadvantage over time
Our analysis focuses on the SEIFA movements of Australian capital city areas between 2006 and 2021, categorised into three clusters. The first cluster includes areas that experienced positive transitions, indicating an increase in socio-economic mobility. Darwin and Hobart stand out in this regard, with a higher proportion of local government areas moving up the SEIFA deciles.
The second cluster consists of areas characterised by negative transitions, where Melbourne, Brisbane, and Perth have seen an increase in the share of disadvantaged areas.
The third cluster represents capital cities that maintained a proportionate share of advantaged and disadvantaged areas over the years, including Sydney, Adelaide, and the Australian Capital Territory.
These patterns become clear when we look at the data. Despite the clusters mentioned, one important thing to note is that changes in socioeconomic status between different levels are generally small and happen gradually, with only a few exceptions. This isn't surprising, considering the factors contributing to the widening gaps between the rich and the poor and the barriers in society.
Recognising the interconnected nature of social and economic identities and how they affect advantage or disadvantage, it becomes evident that public policies need to consider a wider range of factors that influence wellbeing. Achieving this requires close collaboration among all levels of government and across different policy areas to build a more inclusive and fair society for everyone.
FIGURE 1: CAPITAL CITY LGA DISTRIBUTIONS BY SEIFA DECILE, 2006-21
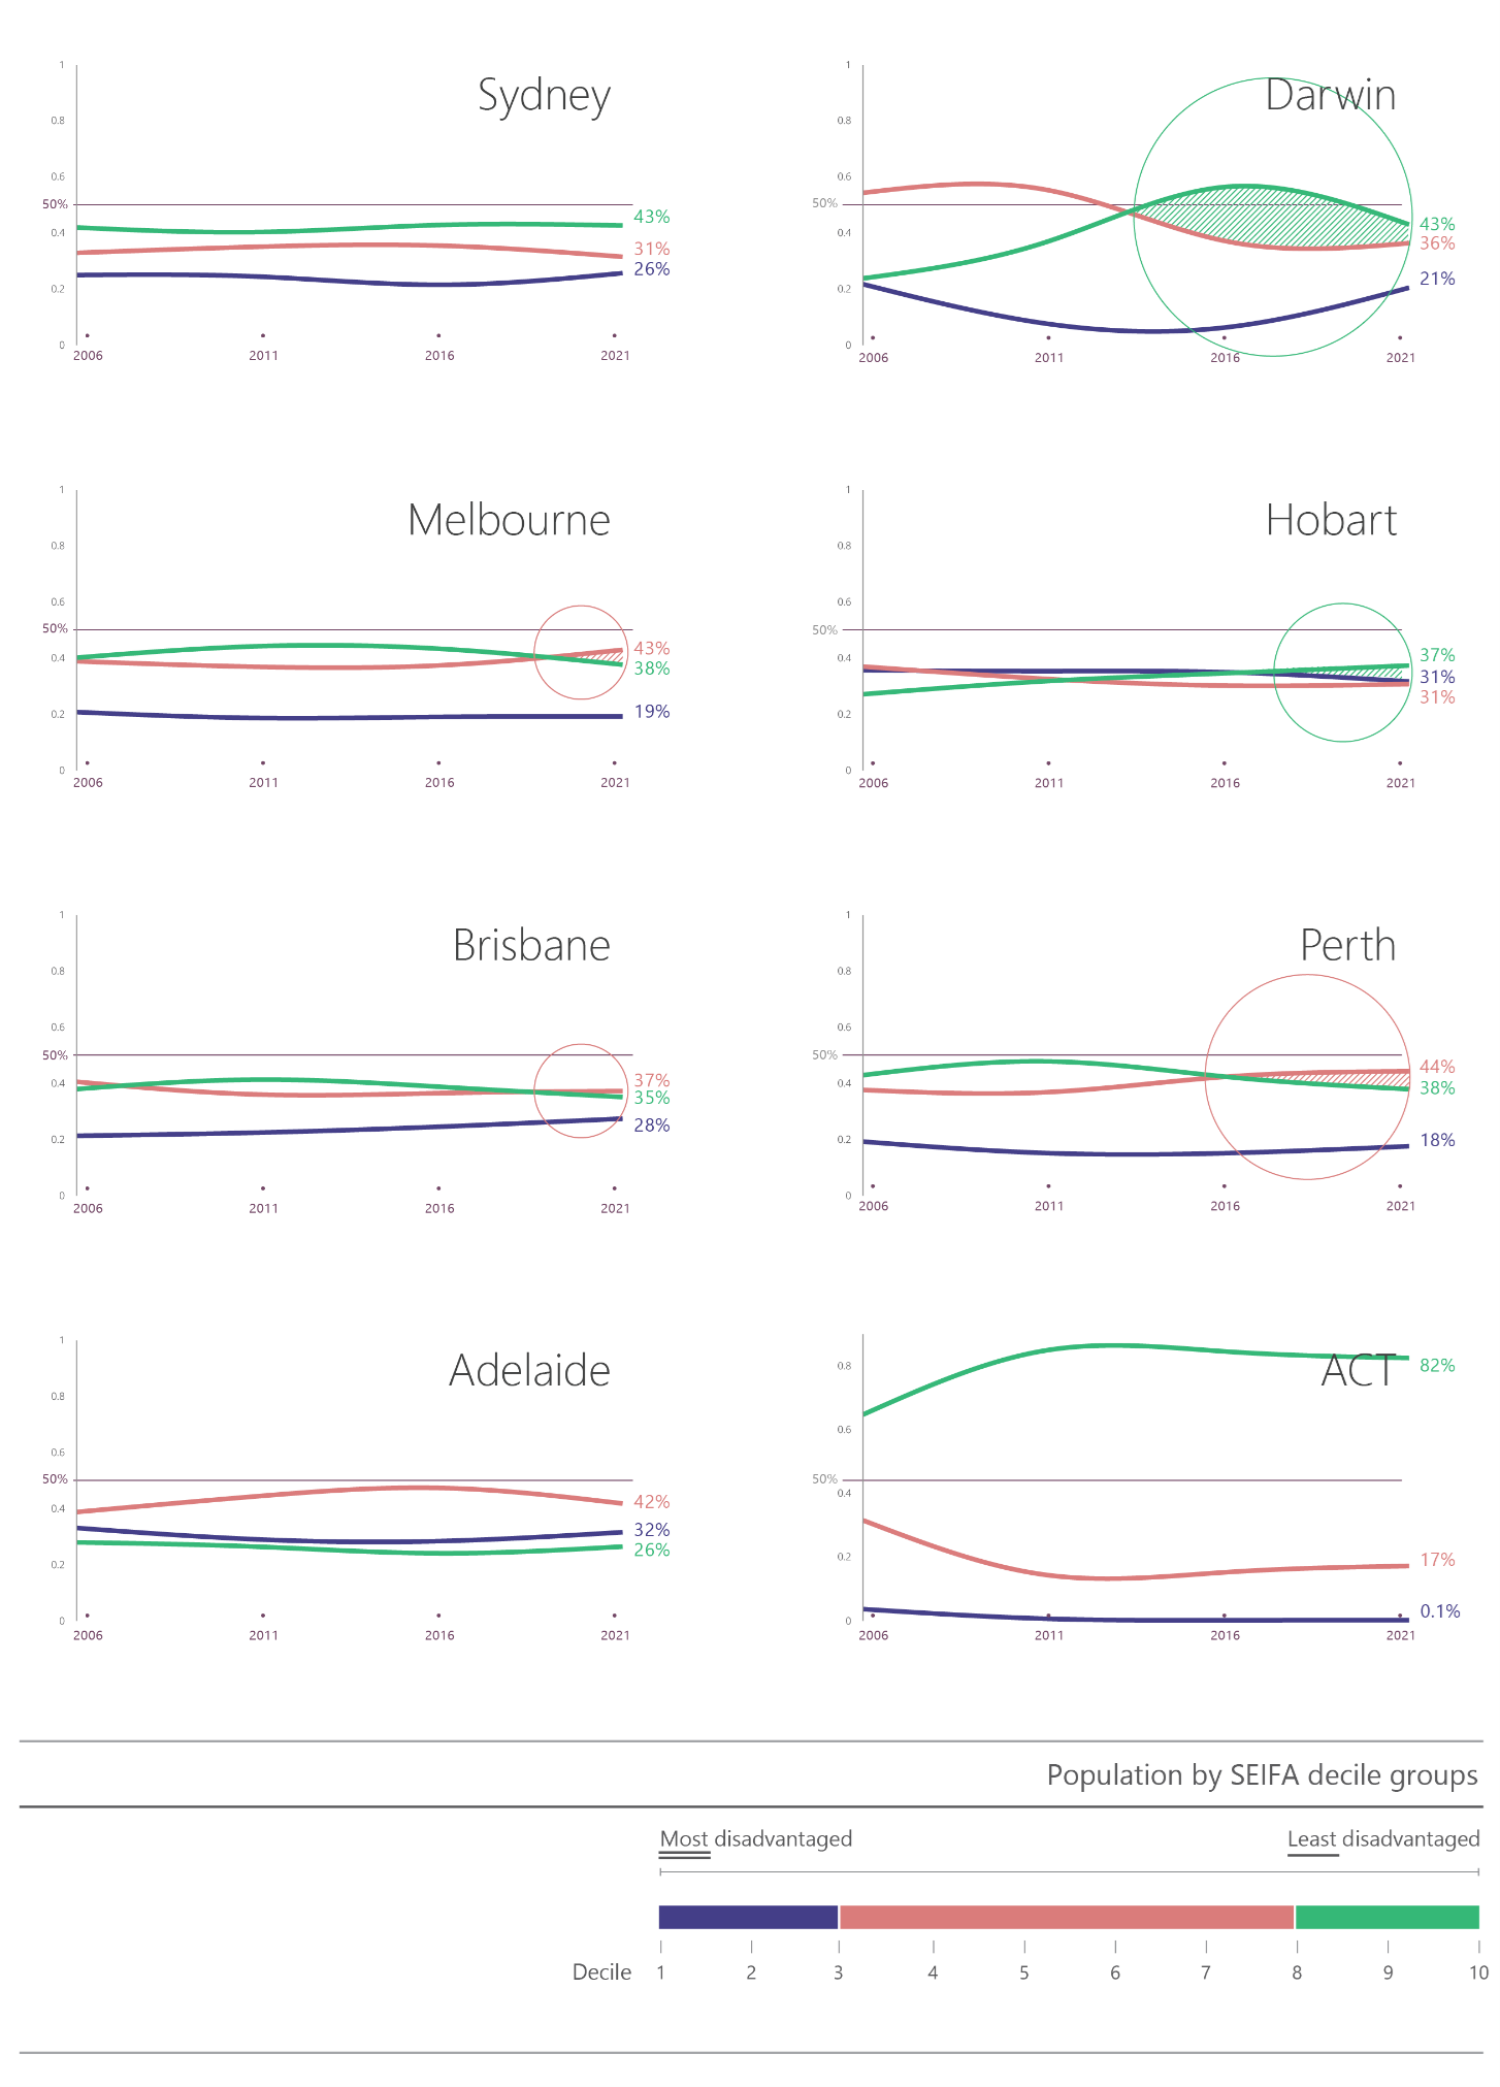

Examining the SEIFA profiles of our cities over time reveals that while some LGAs in Hobart have shown positive transitions, a considerable number remain in the lower deciles. LGAs in Darwin have experienced significant mobility, both upward and downward, between 2006 and 2021. In contrast, the ACT consistently has a higher proportion of more advantaged LGAs compared to other capital cities. These insights highlight the ongoing disparities and call for targeted actions to address disadvantage and promote greater equality.
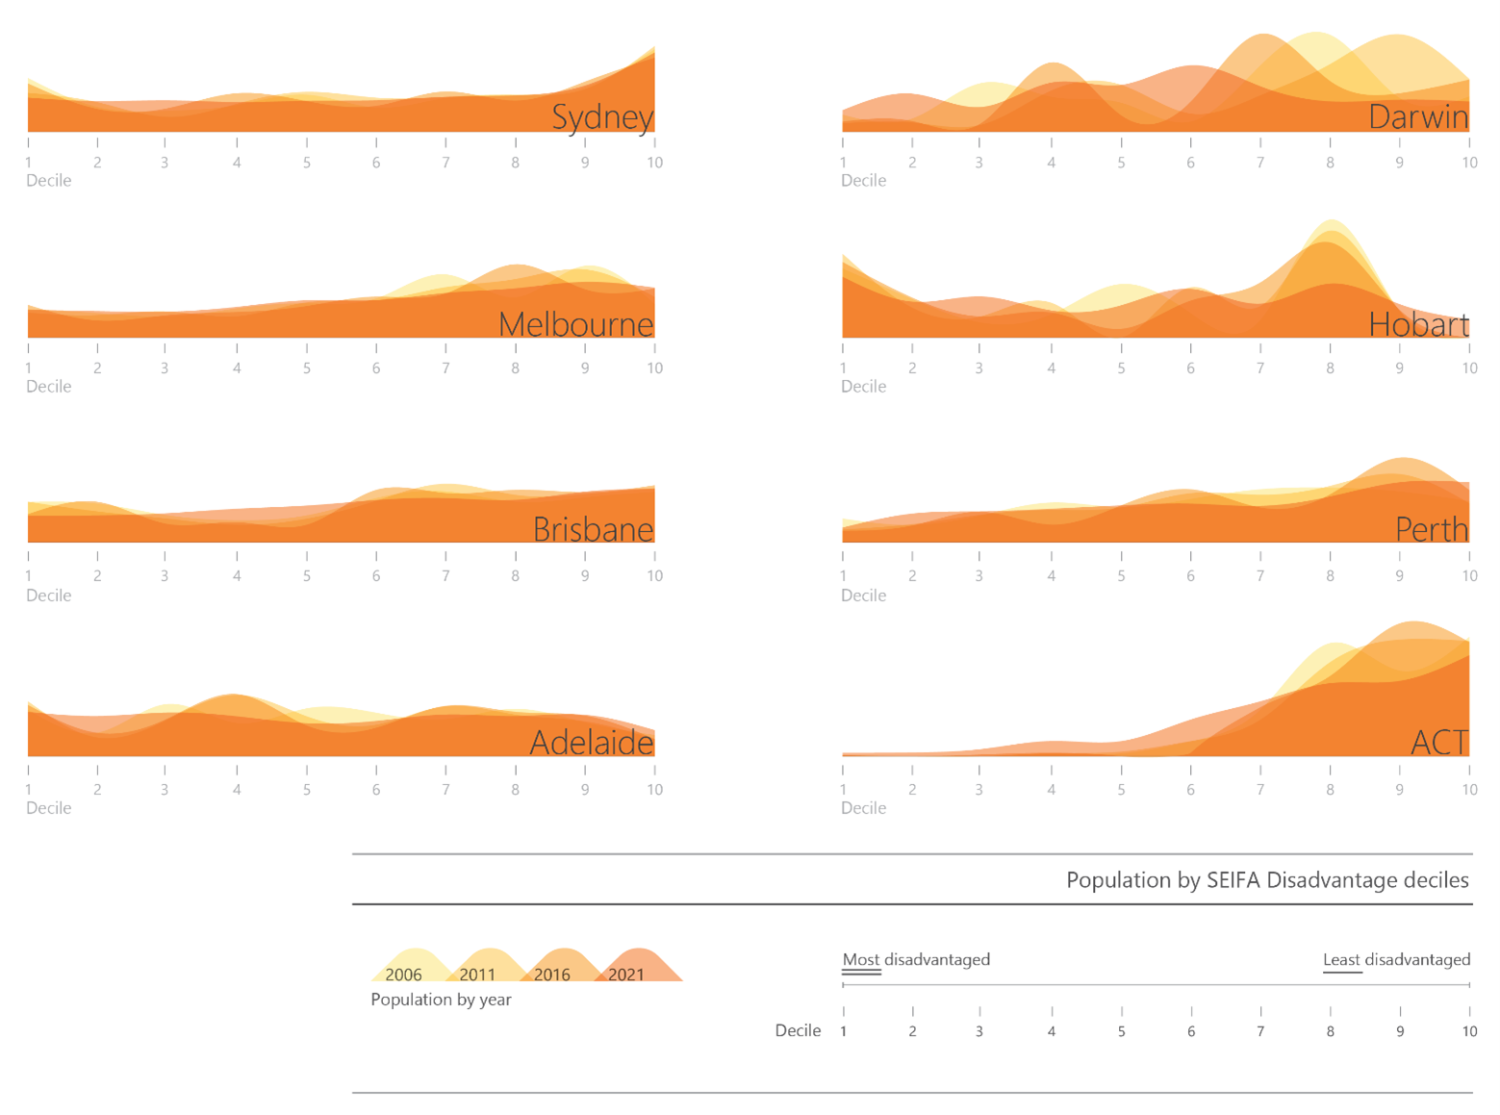
FIGURE 2: INTER-DECILE SEIFA MOVEMENTS OF CAPITAL CITY LGAS, 2006-21

Considerations
Our analysis acknowledges that understanding relative advantage and disadvantage is complicated. Different groups, including citizens, local governments, policymakers, and service providers, may have diverse perspectives on the significance of distributional changes. It's important to consider the implications for service delivery and capacity, and how planning and policy can minimise unintended trade-offs and maximise benefits.
Another important point is the difference between equality of opportunity and equality of outcome. SEIFA uses Census data on income, employment, education, and housing to measure regional outcomes. However, we can't ignore the influence of location and community on upward mobility. It's challenging to determine to what extent policy intervention influences SEIFA movements compared to the broader conditions affecting intergenerational mobility.
Additionally, our analysis doesn't account for movements within deciles or changes in the relative advantage or disadvantage of specific areas between Census periods. These aspects require further exploration to fully understand the evolving socio-economic landscape.
Considering these factors will enable policymakers to make better-informed decisions and implement targeted strategies to address inequalities and create equal opportunities for all.
A version of this article was originally published for LGiU Australia.
Interested in this topic?
This article is related to another piece that looks into how the pandemic is affecting Australia's population growth, based on data. Additionally, we recently released the SGS Cities & Regions Wellbeing Index, a report and interactive tool that assesses the impact of public policy decisions on people's lives in different areas.
Connect with us on LinkedIn